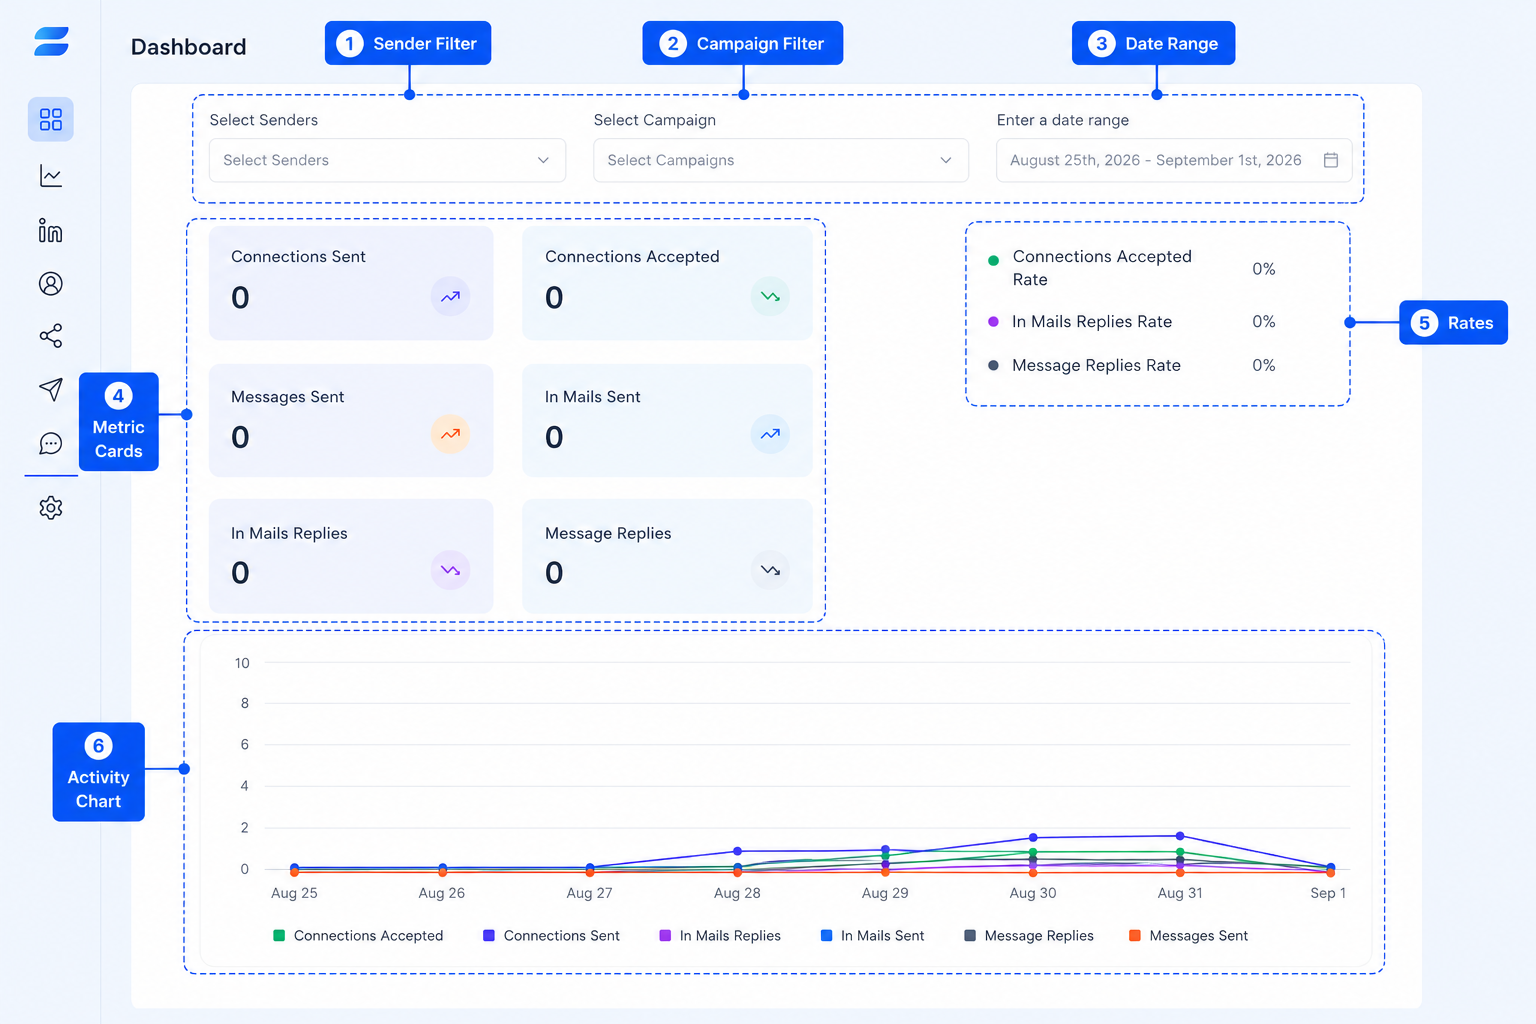
The SendCopy.ai Dashboard gives you a quick view of your outreach activity. Use it to check what has been sent, how prospects are responding, and how activity changes over your selected date range.
At the top of the Dashboard, you can narrow the data you want to review.
Senders - Select the LinkedIn Senders you want to review.
Campaign - Select a specific campaign.
Date range - Choose the period you want to analyze.
You can combine these filters. For example, select one Sender, one campaign, and a specific date range to focus on that campaign's activity.
The number of LinkedIn connection requests sent during the selected period.
The number of connection requests accepted during the selected period.
The number of LinkedIn messages sent during the selected period.
The number of InMails sent during the selected period.
The number of replies received to InMails during the selected period.
The number of replies received to LinkedIn messages during the selected period.
Connections Accepted Rate - Helps you understand how often sent connection requests are accepted.
InMails Replies Rate - Helps you understand how often InMails generate replies.
Message Replies Rate - Helps you understand how often messages generate replies.
Rates provide context for the activity numbers. For example, a high number of messages sent is more useful to evaluate when you also consider how many replies those messages generated.
The Dashboard chart lets you view outreach activity across the selected date range. Depending on the selected filters, you can compare connections, messages, InMails, and replies over time.
Check whether outreach is active.
Review recent sending and reply activity.
Focus on one Sender or campaign.
Get a quick view before opening detailed Analytics.
Use the Dashboard for a quick operational overview. Use Analytics when you want a deeper look at campaign and Sender performance.
If your account is new or there has not been relevant activity during the selected period, the Dashboard may show zero values or no activity. Check that the correct Sender, campaign, and date range are selected.
TIP: When checking performance, always confirm the Sender, Campaign, and date range filters first. Different filter selections can change the numbers you see.
Unibox Overview
Analytics Dashboard Overview